Data Visualization
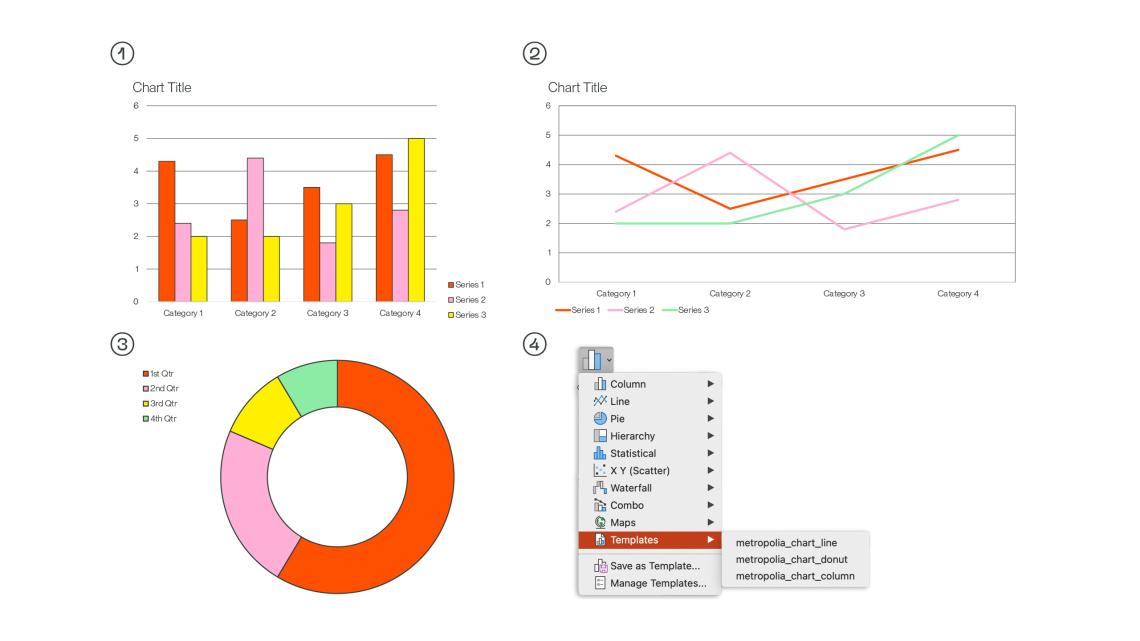
In data visualization, it is essential to use brand and secondary colours to present information clearly.
By default, charts should have dark grey outlines and a white background.
In PowerPoint, predefined chart styles are available and must be applied via the “Templates” section.
Chart types include:
- Column Chart
- Line Chart
- Pie Chart
- Download Predefined Styles
Icons
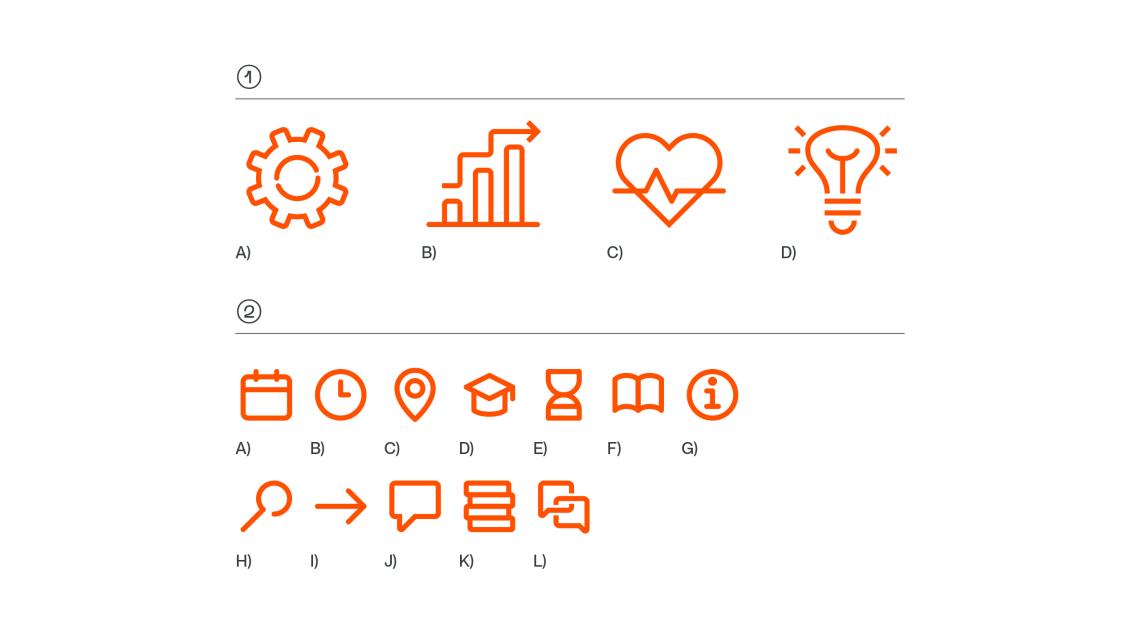
A selection of icons is available for use in various applications as part of designed materials. Icons are available in three colour options:
- Orange
- Grey
- White
A) Technology
B) Business / Economics
C) Health and Social Care
D) Culture
A) Date
B) Time
C) Location
D) Degree
E) Duration
F) Study Mode
G) Info
H) Search
I) Arrow
J) Language
K) Scope / Extent
For web use, a comprehensive open source icon set is used, with a design style that aligns with Metropolia’s visual identity.
Questions About Data Visualization or Icons?
Contact Metropolia Communications at: marketing [at] metropolia.fi (marketing[at]metropolia[dot]fi)


