President and CEO's review
 At the beginning of 2025, Metropolia entered a new strategic period. We are investing in five strategic themes that support renewal: Reforming lifelong learning, Driving Phenomenon-based solutions, Building sustainable development and growth, Forerunning digital transformation and Open and inclusive Metropolia community. In the coming years, Metropolia’s development will be guided not only by the strategy but also by growth targets extending to 2030. These targets cover learning activities, research, development and innovation (RDI), as well as business operations.
The U!REKA European University Alliance, coordinated by Metropolia, has gained strong momentum in its second year of operation. The first concrete outcomes include joint course offerings and new EU-funded collaborative projects with partner universities. Metropolia has also continued its active EU-level advocacy work.
Metropolia’s internationalisation is evident not only in European higher education cooperation but also through new degree programmes in China and Vietnam, as well as a steadily growing international Metropolia community. The number of international students has increased consistently in recent years. As a result, Metropolia is placing greater emphasis on supporting international degree students in settling in, succeeding in their studies and finding employment in Finland in roles that match their expertise and qualifications.
My sincere thanks to our staff, students, partners and stakeholders for their excellent cooperation throughout 2025.
Riitta Konkola
President and CEO
Review of the Chairman of the Board of Directors
 Changes in the operating environment are guiding Metropolia’s strategic choices. In 2025, we have progressed with initiatives that strengthen our role as a producer and renewer of work‑life‑relevant competence both in Finland and internationally. We have sharpened our focus and directed our efforts towards areas where our contribution has the greatest impact: we build competence for sectors in which the availability of skilled labour, productivity and renewal determine Finland’s future. Our impact is created through the close integration of education, RDI activities and working life.
Financially, the year remained stable despite the challenging circumstances. Turnover amounted to EUR 127.7 million, which is EUR 6.9 million less than the previous year. The result for the financial year showed a profit of EUR 0.5 million, and the adjusted result was EUR 2.0 million. The adjusted result takes into account the Ministry of Education and Culture’s front‑loaded funding, as well as the allocation of the continuation funding for the Digivision project.
I warmly thank the entire Metropolia community: our staff, students, owners, and partners. Your work is reflected in skilled graduates, impactful projects and strong partnerships.
We will continue to build Metropolia into an even more influential higher education institution that brings together competence, people and solutions to renew working life and strengthen Finland’s competitiveness.
Ilona Lundström
Chair of the Board of Directors
Review of the Chair of the Board of Student Union METKA
 The year 2025 has been challenging for students across Finland in many ways. Students’ financial situation has tightened at the same time as living costs continue to rise and changes have been made to the student support system. For many students, balancing studies, work and everyday life has become increasingly demanding. In these circumstances, the role of the higher education community becomes ever more important. Students now require more support and a stronger sense of community to help their studies progress smoothly during difficult times.
At the same time, Metropolia’s student community has become increasingly international. The growing number of international students brings new perspectives and expertise to the community, but also requires efforts to ensure that everyone feels included. Tutoring coordinated by METKA plays a key role in this, as tutors help new students find their place within the student community.
In 2025, METKA also undertook significant work to renew Metropolia’s own sports services in collaboration with Metropolia. The renewed services were launched at the beginning of 2026, with the aim of supporting the wellbeing of all people at Metropolia.
Justus Kalliokoski
Chair of the Board of the Student Union METKA (2025)
The year 2025 in numbers
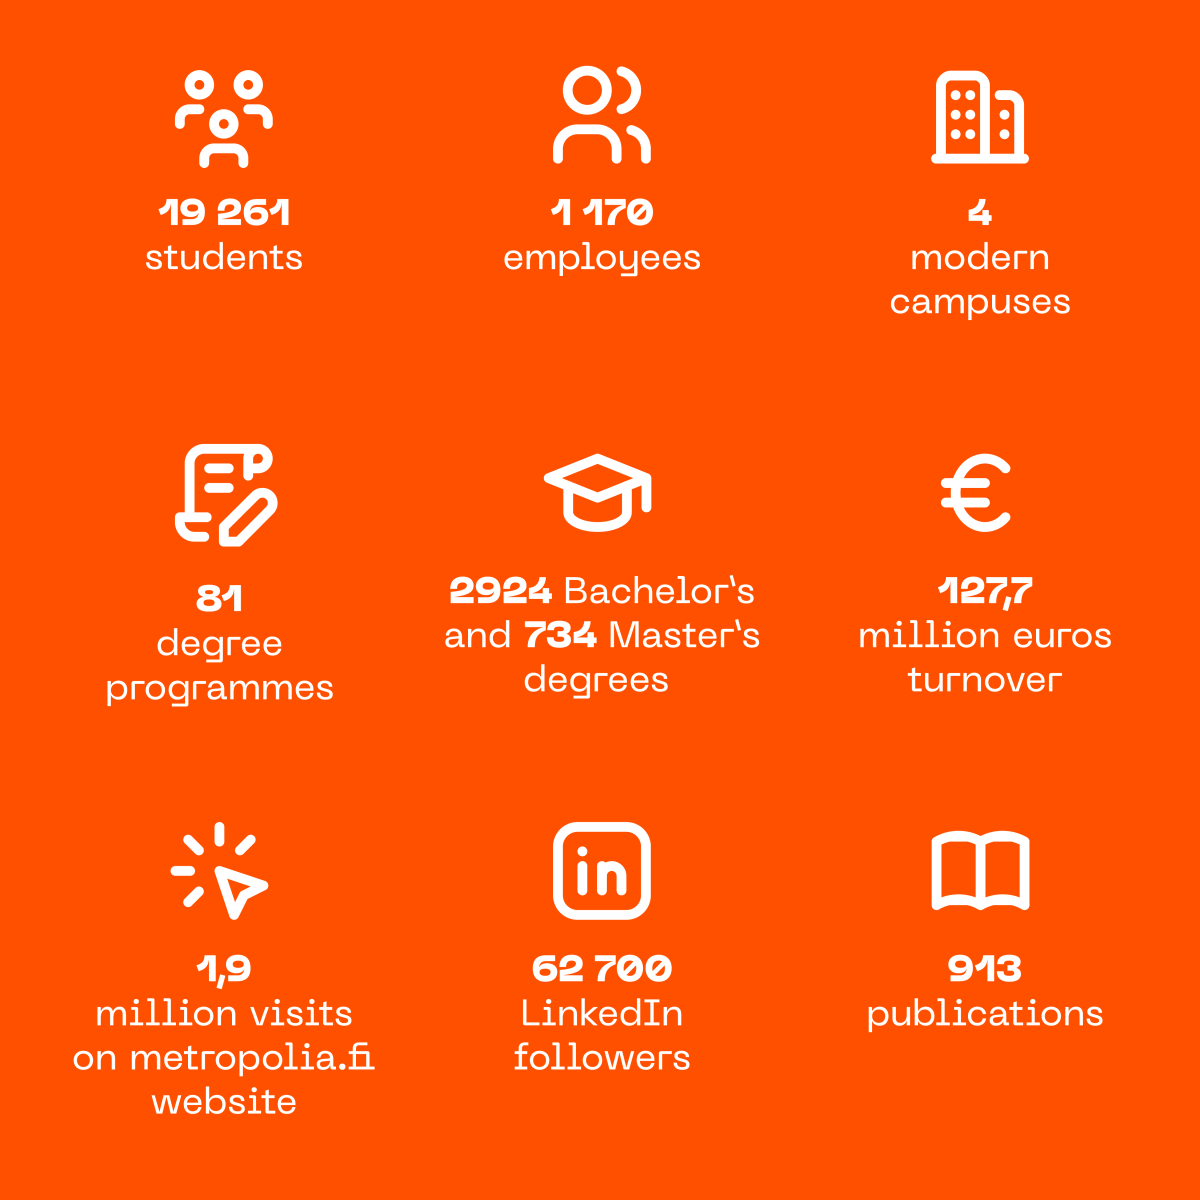
19 261 students
1 170 employees
4 modern campuses
81 degree programmes
2924 bachelor’s and 734 master’s degree graduates
127,7 million euros turnover
1,9 million visits on metropolia.fi website
62 700 LinkedIn followers
913 publications
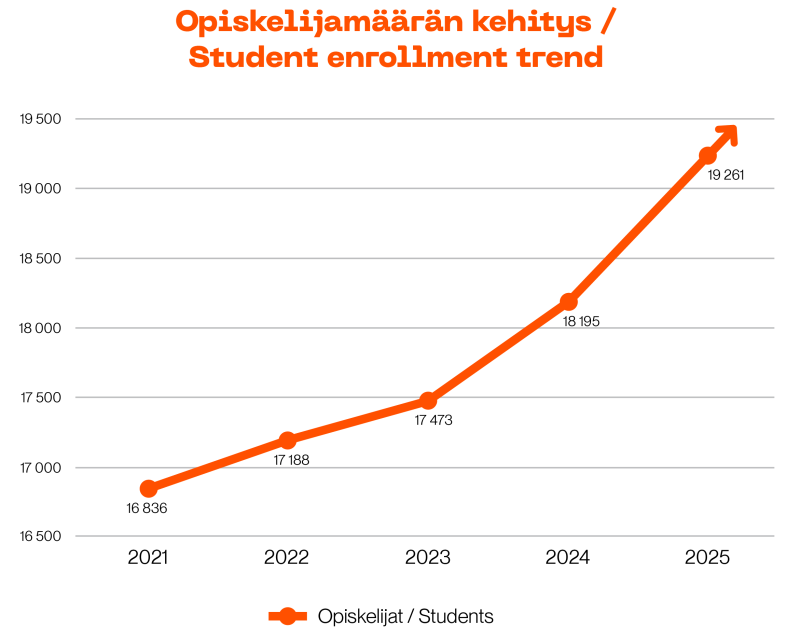
Students
In the autumn semester 2025, Metropolia had 19,261 enrolled students. There were 12,082 full-time degree students and 4,640 students enrolled in blended degree programmes. A total of 2,502 students were completing a Master’s degree, and 37 students were enrolled in specialisation studies.
Student numbers by field of study:
2025: 2098
2024: 2121
2023: 2036
2022: 2016
2025: 1960
2024: 1956
2023: 1878
2022: 1841
2025: 8682
2024: 8202
2023: 7999
2022: 7877
2025: 6521
2024: 5916
2023: 5560
2022: 5454
2025: 19 261
2024: 18 195
2023: 17 473
2022: 17 188
Personnel
 At the end of 2025, Metropolia had a total of 1 170 employees. The overall educational level of staff is high: 69.6% hold at least a higher university degree, and 11.59% of teaching staff have completed doctoral training.
Of all employees, 64% were women and 36% men. Metropolia’s HR system also allows ‘other’ to be selected as gender, but the proportion is currently very small and therefore not visible in the statistics. Among supervisors, 63% were women, and women accounted for 69% of those in management positions.
The average age of staff has slightly decreased in recent years, and at the end of 2025 the average age across the organisation was 48 years.
Metropolia conducts the Eezy Flow PeoplePower personnel survey annually to gather employees’ views on wellbeing at work, the functionality and atmosphere of teams and units, supervisory work, opportunities to participate and influence, as well as leadership and organisational culture. The survey helps to identify Metropolia’s strengths and areas for development.
The PeoplePower Index reflects the overall result of the survey and enables Metropolia to compare its results internally and externally with other organisations participating in the PeoplePower survey. In 2025, Metropolia’s PeoplePower Index was 65.7/100.
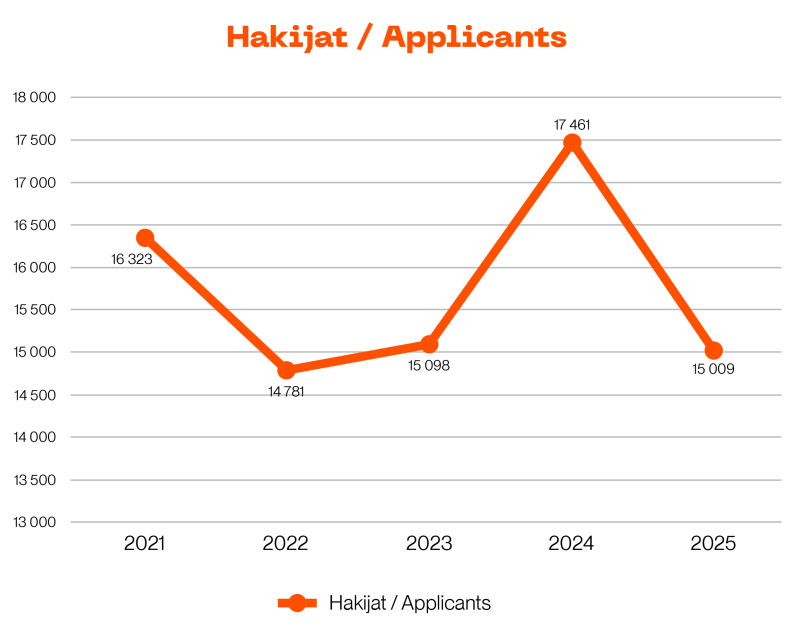
Applicants to Metropolia
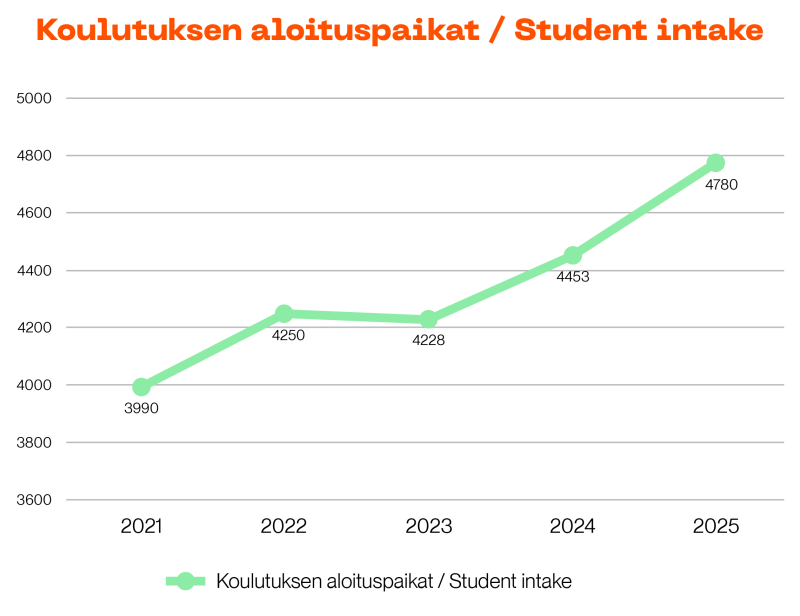
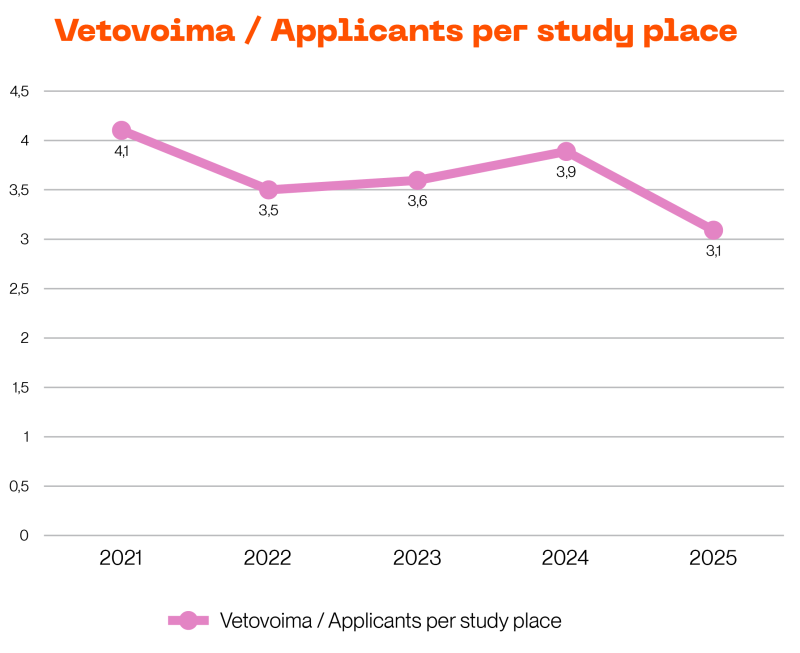
In 2025, Metropolia received a total of 15,009 primary applicants for its bachelor’s and master’s degree programmes (2024: 17,461; 2023: 15,098; 2022: 14,781), and there were 4,780 study places available (2024: 4,453; 2023: 4,228; 2022: 4,250). In 2025, Metropolia’s attraction rate (eligible primary applicants per study place) was 3.1 (2024: 3.9; 2023: 3.6; 2022: 3.48).
Applicants, student intake and applicants per study place by field of study:
2025: applicants 1940, student intake 491, applicants per study place 4,0
2024: applicants 2194, student intake 484, applicants per study place 4,5
2023: applicants 2207, student intake 493, applicants per study place 4,05
2022: applicants 2114, student intake 506, applicants per study place 4,18
2025: applicants 907, student intake 415, applicants per study place 2,2
2024: applicants 1368, student intake 446, applicants per study place 3,1
2023: applicants 1423, student intake 425, applicants per study place 3,3
2022: applicants 895, student intake 435, applicants per study place 2,06
2025: applicants 4188, student intake 1846, applicants per study place 2,3
2024: applicants 4955, student intake 1711, applicants per study place 2,9
2023: applicants 4664, student intake 1615, applicants per study place 2,8
2022: applicants 4045, student intake 1683, applicants per study place 2,4
2025: applicants 8051, student intake 2028, applicants per study place 4,0
2024: applicants 8944, student intake 1812, applicants per study place 4,9
2023: applicants 6895, student intake 1615, applicants per study place 4,3
2022: applicants 7727, student intake 1626, applicants per study place 4,75
2025: applicants 15009, student intake 4780, applicants per study place 3,1
2024: applicants 17461, student intake 4453, applicants per study place 3,9
2023: applicants 15098. student intake 4228, applicants per study place 3,6
2022: applicants 14781, student intake 4250, applicants per study place 3,48
International student exchange
In 2025, a total of 523 students were on international student or trainee exchanges (over 3 months). The corresponding figure was 547 students in 2024, 601 in 2023 and 579 in 2022.
Graduates
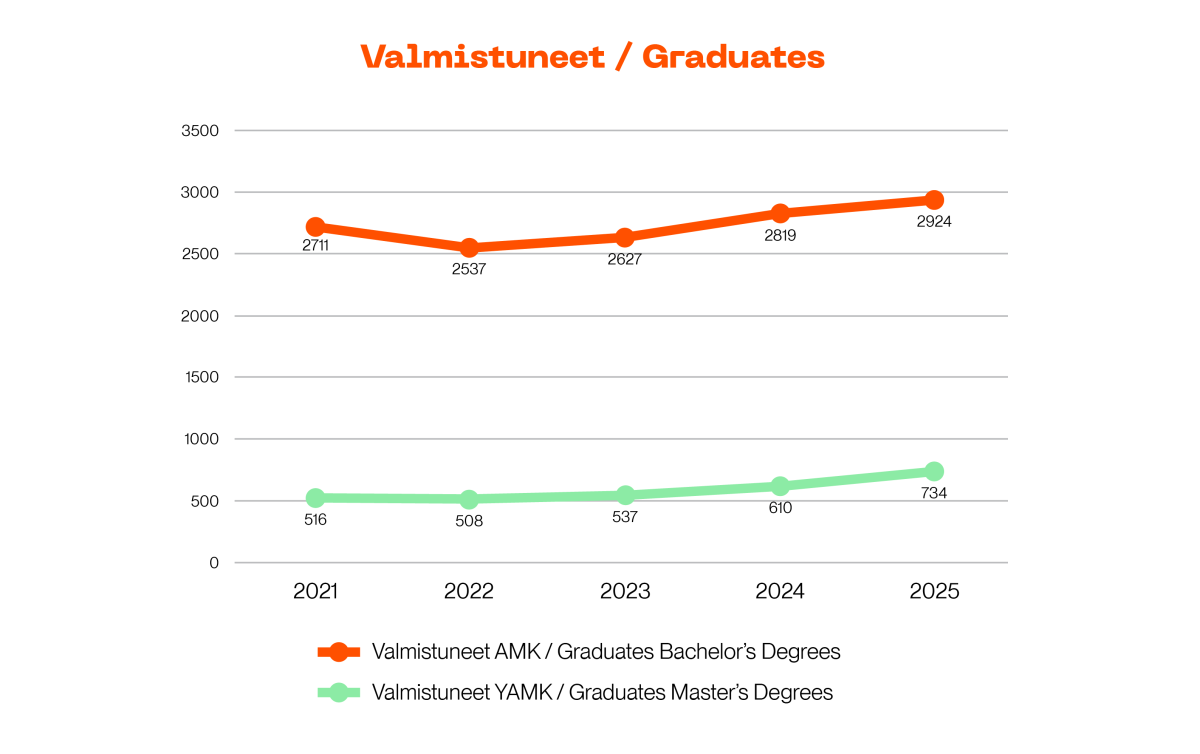
In 2025, a total of 2,924 bachelor’s degrees were completed, which is 105 more than in the previous year. For master’s degrees 734 degrees were completed and there were increase of 124 compared to the previous year.
Bachelor's degree graduates:
2025: 305
2024: 320
2023: 302
2022: 266
2025: 292
2024: 288
2023: 267
2022: 286
2025: 1123
2024: 1167
2023: 1004
2022: 1033
2025: 1204
2024: 1044
2023: 1054
2022: 952
2025: 2924
2024: 2819
2023: 2627
2022: 2537
Master's degree graduates:
2025: 93
2024: 99
2023: 71
2022: 58
2025: 91
2024: 72
2023: 68
2022: 51
2025: 281
2024: 193
2023: 201
2022: 199
2025: 269
2024: 246
2023: 197
2022: 200
2025: 734
2024: 610
2023: 537
2022: 508
Highlights from 2025


Income statement 2025
| 1.1.-31.12.2025 | 1.1.-31.12.2024 | |
|---|---|---|
| REVENUES | 127,685,904.06 | 134,611,592.06 |
| Personnel expenses | -87,904,061.57 | -82,325,479.43 |
| Depreciation and impairment | -6,668,969.68 | -6,809,323.88 |
| Other operating expenses | -34,873,118.13 | -38,524,090.79 |
| EXPENSES | -129,446,149.38 | -127,658,894.10 |
| OPERATING PROFIT | -1,760,245.32 | 6,952,697.96 |
| Financial income and expenses | 2,090,990.36 | 2,573,349.31 |
| PROFIT BEFORE APPROPRIATIONS AND TAXES | 330,745.04 | 9,526,047.27 |
| Appropriations | 296,352.99 | 227,563.86 |
| Taxes on income | -98,064.17 | -295,039.01 |
| PROFIT FOR THE FINANCIAL YEAR | 529,033.86 | 9,458,572.12 |
Balance sheet 2025
| 31.12.2025 | 31.12.2024 | |
|---|---|---|
| ASSETS | ||
| Non-current assets | ||
| Intangible assets | ||
| Intangible rights | 2,823,196.82 | 420,212.79 |
| Other non-current expenditure | 6,403,097.06 | 9,519,979.76 |
| Total intangible assets | 9,226,293.88 | 9,940,192.55 |
| Tangible assets | ||
| Buildings and structures | 92,684.33 | 106,466.41 |
| Machinery and equipment | 8,907,032.35 | 8,053,291.17 |
| Other tangible assets | 17,04.839 | 13,048.39 |
| Advance payments and work in progress | 0.00 | 0.00 |
| Total tangible assets | 9,016,765.07 | 8,172,805.97 |
| Investments | ||
| Other investments | 93,651.00 | 93,651.00 |
| Associated company investments | 0.00 | 100,000.00 |
| Other receivables | 62,359,812.58 | 61,724,309.94 |
| Total investments | 62,453,463.58 | 61,917,960.94 |
| TOTAL NON-CURRENT ASSETS | 80,696,522.53 | 80,030,959.46 |
| Current assets | ||
| Non-current receivables | ||
| Other receivables | 9,008,242.13 | 6,325,986.93 |
| Prepayments and accrued income | 240.00 | 240.00 |
| Total non-current receivables | 9,008,482.13 | 6,326,226.93 |
| Current receivables | ||
| Trade receivables | 989,492.81 | 1,291,262.89 |
| Other receivables | 2,812,593.39 | 2,218,525.43 |
| Prepayments and accrued income | 2,540,315.40 | 1,723,574.17 |
| Financial securities | 2,247,265.50 | 3,166,948.39 |
| Total current receivables | 8,589,667.10 | 8,400,310.88 |
| Cash and cash equivalents | 1,582,222.89 | 4,893,140.43 |
| TOTAL CURRENT ASSETS | 19,180,372.12 | 19,619,678.24 |
| TOTAL ASSETS | 99,876,894.65 | 99,650,637.70 |
| EQUITY AND LIABILITIES | ||
| Equity | ||
| Share capital | 4,500,000.00 | 4,500,000.00 |
| Other reserves | ||
| Reserve for invested unrestricted equity | 6,480,117.92 | 6,480,117.92 |
| Reserve for donations received | 205,662.86 | 510,378.41 |
| Other reserves | 105,021.50 | 106,658.94 |
| Other reserves Total | 6,790,802.28 | 7,097,155.27 |
| Profit/loss from previous years brought forward | 56,875,745.44 | 47,417,173.32 |
| Profit/loss for the period | 529,033.86 | 9,458,572.12 |
| TOTAL EQUITY | 68,695,581.58 | 68,472,900.71 |
| Mandatory provisions | 100,000.00 | 567,163.73 |
| Non-current liabilities | 0.00 | 0.00 |
| Current liabilities | ||
| Prepayments received | 7,054,524.94 | 9,322,434.18 |
| Trade payables | 3,555,436.28 | 4,829,730.67 |
| Other liabilities | 11,840,712.88 | 9,012,958.81 |
| Accrued liabilities | 8,630,638.97 | 7,445,449.60 |
| Total current liabilities | 31,081,313.07 | 30,610,573.26 |
| TOTAL LIABILITIES | 31,081,313.07 | 30,610,573.26 |
| TOTAL EQUITY AND LIABILITIE | 99,876,894.65 | 99,650,637.70 |